Land Cover Monitoring System

The purpose of LCMS is to perform automatic land cover classification, crop type classification and detection of changes in land cover through time. All that is done using ML and it works on a level of an entire country, in a continuous manner!
Overall we can divide LCMS into 4 parts:
- Collection and preparation of reference data
- Data-processing pipelines to run ML process and produce results
- Storage and serving of results
- Application for operators
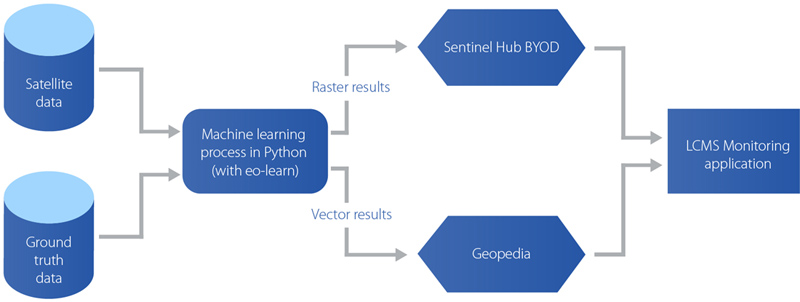
A basic schema of LCMS implemented for Azerbaijan.
Reference data
There are 2 kinds of data LCMS requires as an input. One is satellite data, which is accessible through Sentinel Hub services in a simple manner, and the other one is ground-truth reference data.
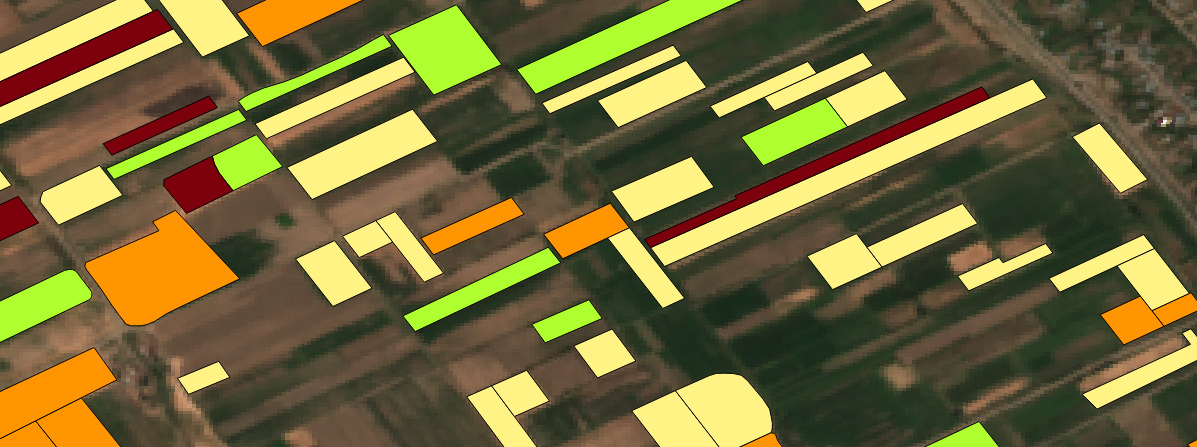
Ground-truth data for crop classification overlaying the Sentinel-2 L2A image.
The quality and quantity of ground-truth polygons are extremely important for LCMS since it employs supervised ML algorithms to solve classification problems. There is a general rule of ML that results can only be as accurate as the data used for training. This clearly applies to our use-case as well.
No matter what kind of land cover classification is performed, all types of surface from the area of interest have to be well represented in the training data. For land cover classification at the country level, we need ground-truth polygons that are evenly distributed over the entire country. In the end it doesn’t matter that much whether they cover 1%, 10% or 100% of the country, as long as the surface of the covered area is as diverse as the surface of the entire country.
Good sources of land cover data are cadastral databases and LPIS systems. Many countries already have such systems and they spend a lot of manual work to keep the data reasonably accurate and up-to-date. However, in some cases such data doesn’t exist or is not accessible. Then the alternatives are to manually label data yourself or to use various open data sources and fuse them together. One such example is Open Street Map, which is maintained by a large community of people.
Similarly, for crop type classification, ground-truth data has to evenly cover all arable land. It turns out that ML models trained on one year don’t perform well for other years. Therefore, accurate data is required for each year separately, and for each crop rotation if applicable. One way to obtain large quantities of such data is to use farmer declarations.
Data-processing pipelines
The most important part of LCMS are data-processing pipelines. Their job is to perform the entire ML process, which spans from collecting data to producing results. To learn how exactly we do this process, take a look at our previous blog posts about Land cover classification with eo-learn (part 1, part 2 and part 3). Pipelines are simply built on top of eo-learn tasks and workflows, providing additional functionalities for upscaling the area of interest, delegating workflow executions, storage management, logging, and various other useful utilities.
One important aspect of pipelines is that they split up the country into smaller chunks and for each one we create an EOPatch, which stores all the data from that location. This way pipelines can execute operations on multiple EOPatches in parallel and at the same time keep in memory only as much data as there are available resources. Furthermore, pipelines are able to divide the processing of EOPatches over multiple EC2 instances on Amazon Web Services (AWS). This makes the execution part of the pipeline much faster and more convenient.
Having the whole process split into multiple pipelines also helps to manage the complexity of development and enables us to easily experiment on only a subset of data. We have thus split our data-processing into the following pipelines:
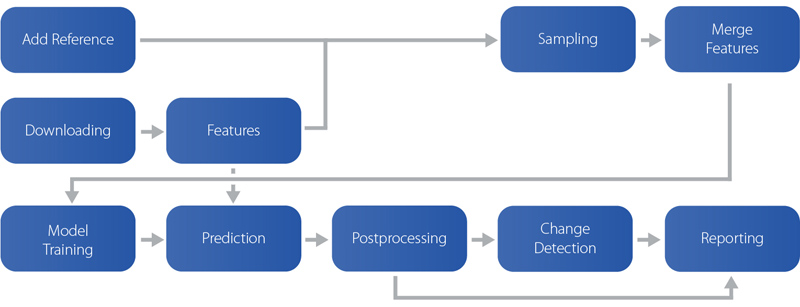
A schema showing how pipelines are connected together.
- Download: Loads satellite imagery using Sentinel Hub, computes cloud and valid data masks and stores them into EOPatches.
- Features: Computes features such as NDVI, NDWI, NDBI, tasselated-cap indices, and performs temporal harmonization (i.e. interpolation or mosaicking). This part will be in the future offloaded to Sinergise’s next frontier — Euro Data Cube.
- Add reference: Transforms ground-truth reference polygons into raster masks.
- Sampling: Spatially samples features based on reference data. Only the subset of sampled locations will be used for ML training.
- Merge features: Merges sampled features together by concatenating them into
numpyarrays. The result are multiple ML-ready datasets. - Model training: Uses the datasets as inputs to train and test a ML classifier and saves a trained model.
- Prediction: Runs a country-wide prediction based on the model. The result of this pipeline is classification maps.
- Post-processing: Performs various operations on classification maps, such as super-pixel segmentation, filtering, erosion, etc.
- Change detection: Compares the resulting maps for ‘before’ and ‘after’ and finds areas where it is most likely that a change has happened.
- Reporting: Collects various statistical information from resulting maps and creates reports for operators.
Storage and services
Execution of data-processing pipelines requires a lot of computational power and it can take up to a few days. In the end the results are raster classification maps and vector polygons of detected changes. These results have to be stored somewhere and we need a service to provide them to operators whenever requested.
A solution for raster maps is the “Bring Your Own Data” feature of Sentinel Hub. The maps can be stored on an AWS S3 bucket. By following the instructions, we can configure the bucket permissions and a Sentinel Hub layer according to the structure of data in the bucket. Once that is done, Sentinel Hub services are able to read and provide any part of a map an operator would require.
Regarding vector data, a solution is to upload the polygons into a geospatial database and use a service for querying them. All this can be done using Geopedia. We can simply create a new Geopedia layer, import the data and then use Geopedia REST API to query the data.
Application for operators
Depending on the use case, classification results can be shown either in a simple viewer (e.g. Sentinel Playground) or they can be a part of a full GIS application.
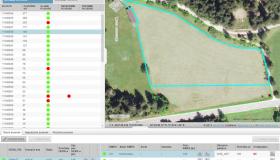
For Azerbaijan, we developed a custom application that provides access to the entire archive of Sentinel-2 and Landsat 8 data.
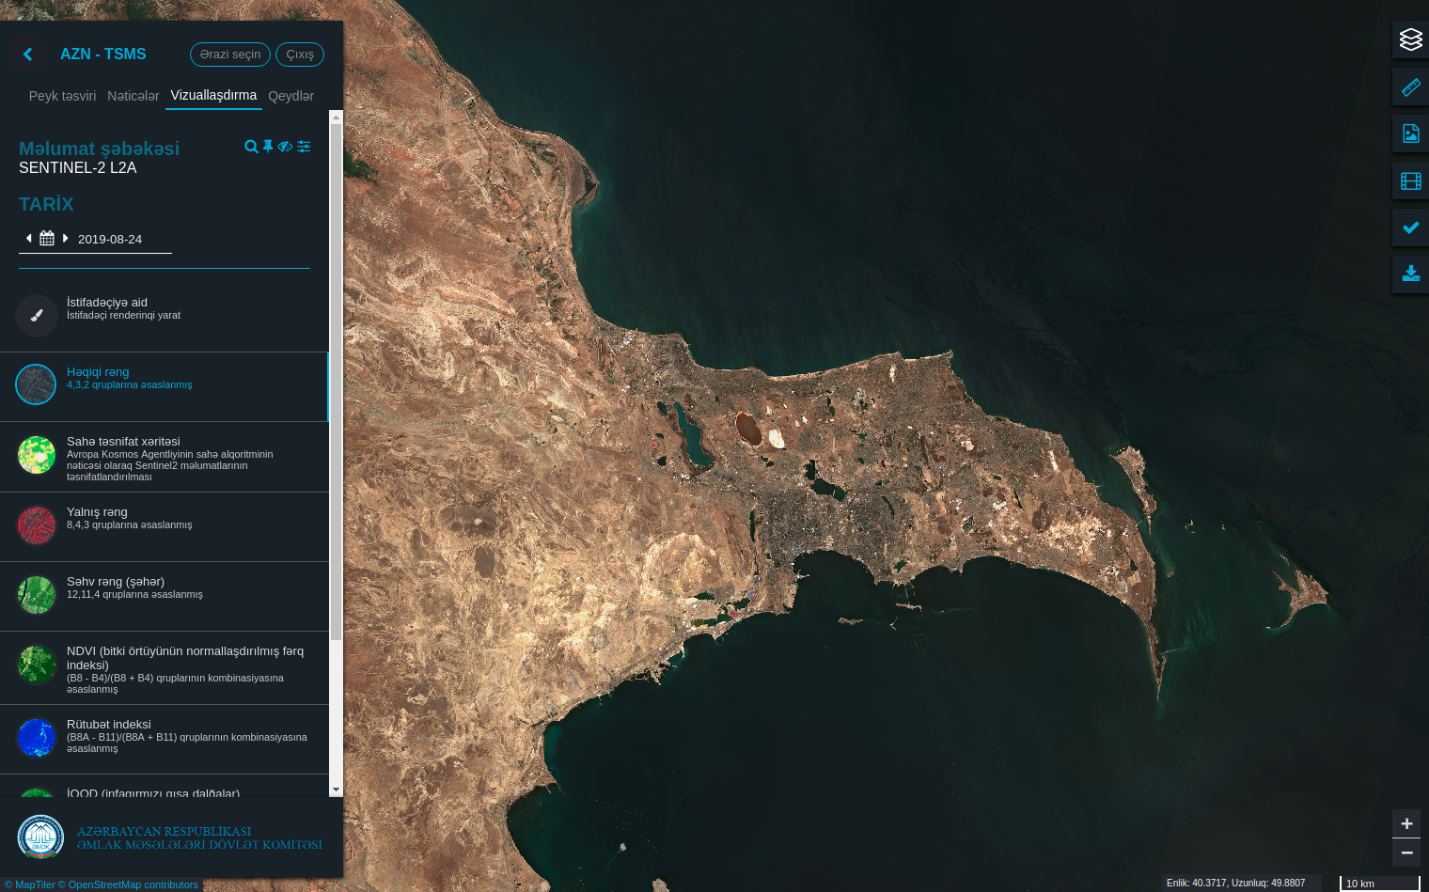
A custom application for Azerbaijan with the entire Sentinel-2 and Landsat 8 data archives.
It enables viewing classification maps, comparing them to each other and comparing them to satellite data.
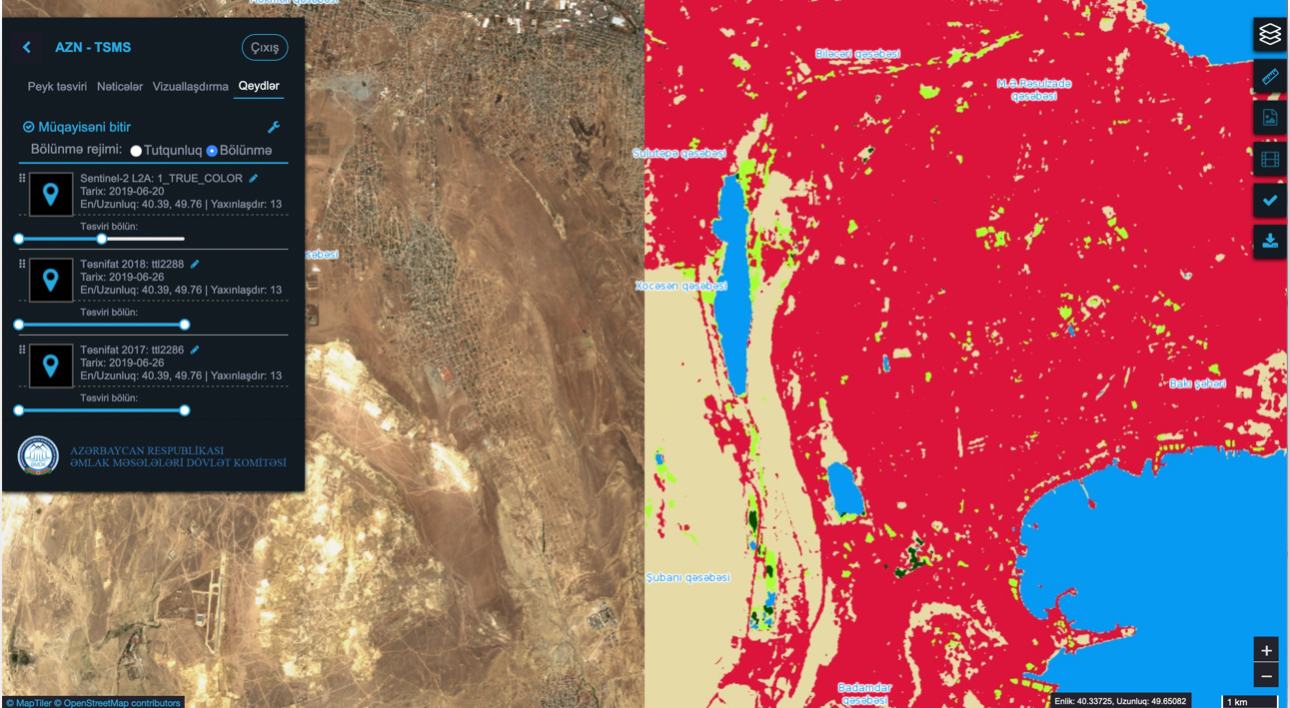
Comparing the Sentinel-2 image with land cover classification.
The Validation Tool is one of the most relevant features of the application, particularly for land change detection. It provides a list of all detected changes in land cover. An operator can select a detected change, check the corresponding satellite imagery for that location and decide if the change has been correctly detected or if it is a false positive. In the latter case, the operator can decide to correct the change and submit it back to the system. In the end, operators get a list of land cover changes, which have been confirmed to be correct, and the system gets new reference data for the next iteration of the ML process.
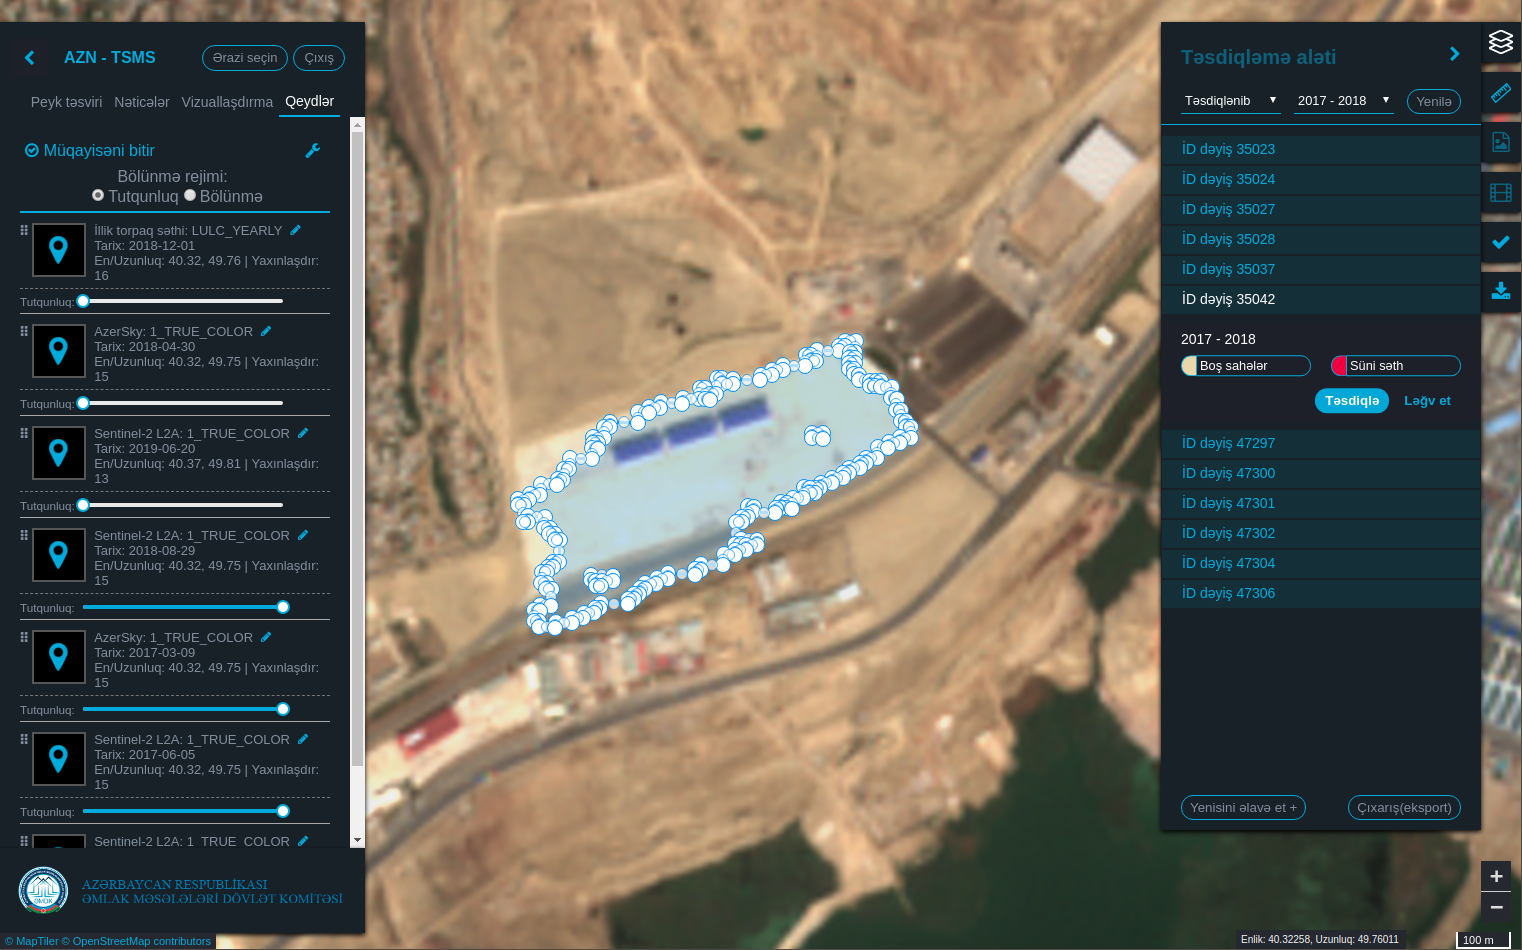
Detected land cover change — a new building has been built.