Area Monitoring Service

CAP Area Monitoring Marker Service
Freely available multi-temporal Sentinel data, as well as advancements in storage, retrieval and analysis, have made feasible the processing of massive amounts of data for environmental monitoring and control. The huge subsidies provided by the EU CAP have provided a compelling business case that has demanded the widespread adoption and use of all available technology in order to drive efficiencies in the monitoring and control of the IACS schemes. While Sentinel data are not of sufficiently high spatial resolution to provide the accuracy and definitive level on which strict penalties are based, their radiometric characteristics and multi-temporal richness and affordability over large areas, combined with advances in ML and supporting techniques, supports the routine monitoring of several important “measures”. Thus, the use of Sentinel data, facilitated by massive data processing and analysis by ML and other advanced signal-processing techniques, supports a potential transition from small, sample risk-based examination (say 5% of claims) to complete area monitoring of all claims (100%), especially when supported by an Expert Judgement Process.
Sinergise have combined their vast experience with CAP applications (LPIS and GSAA), world-leading Sentinel hosting and processing with significant research and development into machine learning (ML) and other signal-processing techniques to develop a generic service for crop markers right across Europe.
The service is described in detail in the Area Monitoring Service Documentation and in a series of blog posts.
Achievable Markers
The current stage of development is summarised by the diagram below:
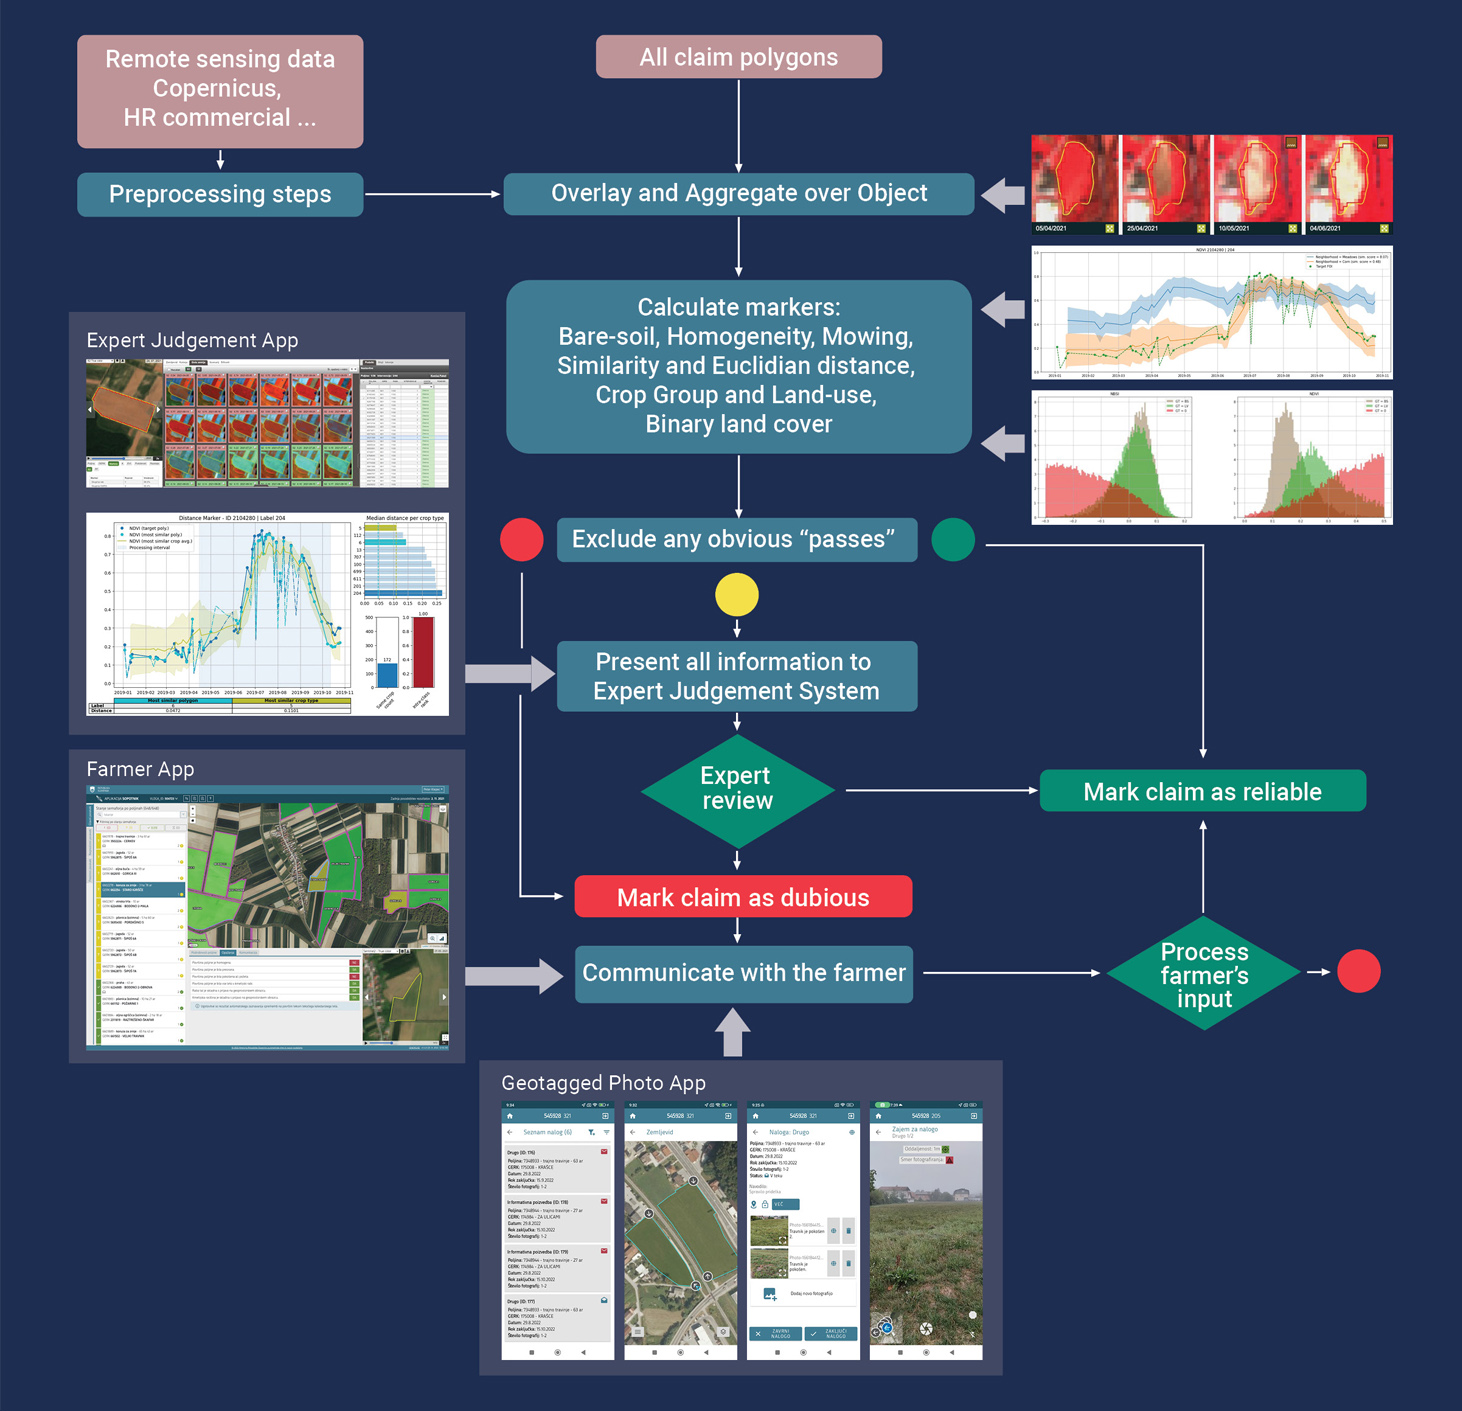
Farmers’ data from the Geospatial Aid Application (GSAA) dataset is used to retrieve information about parcel boundaries, their attributes (e.g. crop type, and sometimes land cover and crop group), and measures, providing a dataset of million and more Features of Interest (FOI) per year. All of that data is ingested at the start of processing.
All available satellite imagery is also retrieved and cloud masks are calculated from those imagery pixels that are completely within FOIs boundaries (non border pixels). This is optimised using Sentinel Hub’s Batch Processing API. The reflectances are then converted to vegetation indices, which are statistically summarised (obtaining mean, standard deviation, minimum and maximum) per FOI.
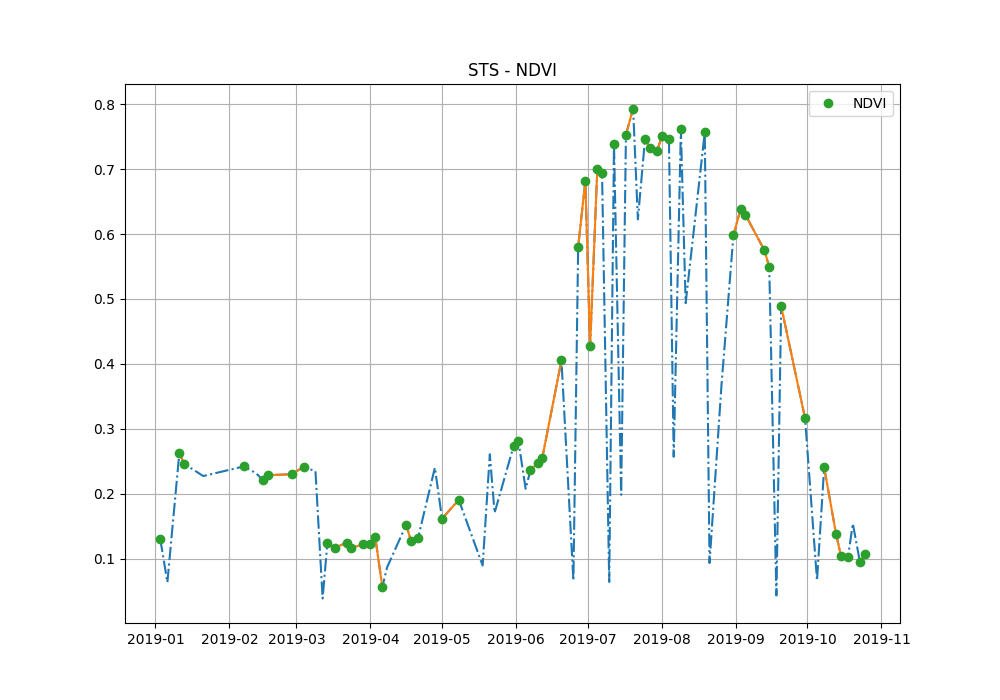
In the figure below, time-series of mean Normalized Difference Vegetation Index (NDVI) obtained using Sentinel Hub’s Batch Processing API request for a particular FOI, is shown as a blue dash-dotted line. Sudden drops of NDVI can be seen, and these are attributed to cloudy observations, which can be identified and filtered out with Sentinel Hub’s “s2cloudless” cloud-masking algorithm. The green dots indicate all remaining valid observations. All current markers, including the crop type marker, work on time-series “signals” like the one illustrated here.
Processing hundreds of thousands of individual signals like these can yield informative “markers” which require little additional input and can easily be generated across a large region. Some of these address specific rules directly, and some of them can be used in combination — e.g. to detect ineligible areas, which do not have their own marker. Apart from the satellite data, most require only polygon boundaries, land cover and/or crop type classifications — data that are readily available within paying agencies and that should, according to EU legislation, also be publicly accessible.
Markers developed to date include:
- Similarity —all claims for a crop of a certain group, in the local neighbourhood (say within 20km and a similar altitude) should produce a similar signal
- Homogeneity —all pixels in a field of the same crop at the same time, should have a similar spatio-spectral response (with only small variations due to local soil or topographic differences, for example).
- Bare Soil — low values or sudden drops in a vegetation index profile indicate bare soil, which may be related to one or more ploughing events.
- Mowing and Harvesting — these are similar markers to the bare soil ones, but, when related to certain cop groups and their phenological behaviour, can be deduced as likely mowing and harvesting markers
- Land Cover categories which are indicated on claims (arable land, grassland and permanent crops) can also be used to generate markers, from which outliers will likely indicate non-agricultural ineligible areas
- Crop Type — an additional marker that is still useful in combination with the others, especially for more complex measures
- Segmentation— automatic segmentation methods based on spatial, multi-temporal and multi-spectral responses may assist in detecting altered parcel boundaries, to serve as a supplementary layer to update parcel boundaries, especially when combined with homogeneity and land cover markers.
All markers provide a range of values, a probability or likelihood that a particular FOI is the claimed crop or not. If the probabilities indicate that there is no problem with a claimed parcel, it can be channelled as a “pass”, but in other cases, the markers may lean heavily to its recategorization. or at least more detailed examination.
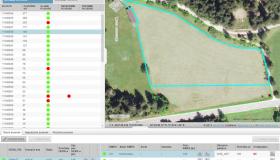
Expert Judgement Application
As shown, many steps and markers can be automatically generated, but the subject is so complex, that it is likely that thousands or tens of thousands of cases will remain ambiguous, and will need to be confirmed by expert visual analysis. Hence, Sinergise has also developed an efficient, well-integrated Expert Judgement Application, optimised to present all the relevant data (including markers and likelihood measures) to an “expert” operator, in a FOI-driven workflow that can be prioritised by value, crop, or other selected factor. The expert is able to look at various images, time-series charts and statistics and make a prompt yes/no/can’t tell decision for each FOI presented. Only in the most complex (unusual) cases, should it require visual examination of each image in an available data series. Decisions made by experts will be fed back to the ML process to improve the accuracy for the next iteration.
A combination of automated ML-based techniques with an efficient expert-based judgement process, which can feedback and re-train ML-bases, yields iterative, exponential improvements.
Optimization of the IT Process
A well-designed IT system, which integrates various processing steps and options in the form of micro-services is thus an essential tool so that the complete chain can be fully automated with no duplication. There should be no manual step required in the processing chain to prevent delays and to ensure fast iteration by being able to reproduce results immediately.
Many of the steps described can be performed remotely and generically and it should be possible to evolve to ordering marker services, in much the same was as one can order VHR data. In most cases, these will not require extensive customization. An indispensable input is a layer of claims (polygons, crops, measures); the rest can often be derived directly from the data. The best approach for using such solutions are “microservices” in the form of APIs, which can be easily integrated into PA’s existing tools.
Further reading
We have posted a series of blog posts related to our work in Area Monitoring. We have decided to openly share our knowledge on this subject as we believe that discussion and comparison of approaches are required among all the groups involved in it. We would welcome any kind of feedback, ideas and lessons learned. For those willing to do it publicly, we are happy to host them at this place.
The content:
- High-Level Concept
- Data Handling
- Outlier Detection
- Identifying built-up areas
- Similarity Score
- Bare Soil Marker
- Mowing Marker
- Pixel-level Mowing Marker
- Crop Type Marker
- Homogeneity Marker
- Parcel Boundary Detection
- Land Cover Classification (still to come)
- Minimum Agriculture Activity (still to come)
- Combining the Markers into Decisions
- The Challenge of Small Parcels
- The value of super resolution — real world use case
- Traffic Light System
- Expert Judgement Application
- Agricultural Activity Throughout the Year